Google Maps Review Analysis
IKEA Greenwich London
I’m exploring the customer experience at IKEA Greenwich, arguably the most sustainable IKEA store in the world. Opened in February 2019 and boasting an ‘outstanding’ BREEAM certification, the store is a prime example of sustainable building and community-focused design. But beyond the awards, I’m curious to see how it looks through the eyes of its customers.

Using a dataset of over 10.000 Google Maps reviews scraped via Outscraper.com, this exploratory data analysis focuses on assessing the current state of customer perception based on a comprehensive evaluation of publicly available customer feedback. The quantitative analysis focuses on trends and patterns in the frequency and distribution of customer of customer reviews over the years.
If you’re curious to see the entire notebook where I clean it and perform some detailed analysis, you can check it out on my GitHub repository.
1. Quantitative Evaluation
Introduction to the data set
First, I imported the necessary libraries: pandas, numpy, matplotlib, and seaborn. Then, I loaded the dataset from ‘greenwich.csv’ and created a subset with the columns ‘review_datetime_utc’, ‘review_rating’, and ‘review_text’, renaming them to ‘date’, ‘rating’, and ‘review’ respectively. After converting the ‘date’ column to a pandas datetime format, I confirmed there were no missing values and checked for duplicate rows, confirming there were zero duplicates. Finally, I saved this cleaned subset as ‘greenwich’. Below are both the first and last three rows of the DataFrame, which I’ll use for the quantitative analysis part:
| date | rating | review | |
|---|---|---|---|
| 0 | 2024-04-17 08:08:59 | 4 | NaN |
| 1 | 2024-04-16 21:47:40 | 4 | NaN |
| 2 | 2024-04-16 18:36:30 | 5 | This is an Ikea with a view, and a terrace! |
| 10149 | 2018-12-01 17:29:03 | 5 | Can't wait, this store is gonna be awesome! |
| 10150 | 2018-11-19 14:43:59 | 5 | I am waiting ! My favourite store ! |
| 10151 | 2018-11-11 23:44:26 | 5 | NaN |
At the time of this evaluation, the data set contained 10152 entries, with the first entry
on November 11, 2018 and the last entry on April 17, 2024.
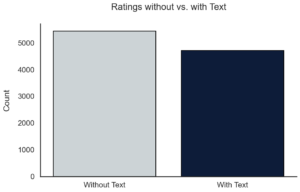
A total of 4706 customers submitted a written review (vs. 5446 without). People tend to invest the minimum cognitive effort required for a task. Giving a star rating requires less thought and time than formulating a written review. Or leaving a rating at all. Only a very small percentage of customers give feedback, let alone a written review.
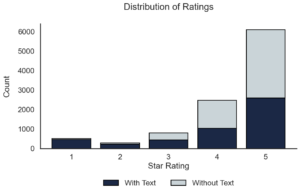
5-star reviews are the most common. This indicates that a large number of customers have had a positive experience. Many users tend to leave a rating without a written review, especially if they are satisfied. When people have positive experiences, they often see this as the ‘norm’ or an expected outcome and therefore may not feel compelled to write about it. Customers with negative experiences (1- or 2-star ratings), on the other hand, may be more motivated to leave reviews to share their complaints, provide feedback or warn other potential customers. This can lead to a higher proportion of written reviews for lower star ratings compared to higher ones.
Number of ratings
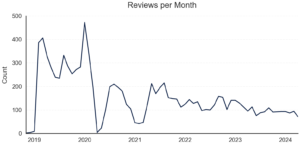
The graph showcasing the monthly review counts reflects typical consumer engagement trends over time following a new store opening. Here are some key insights:
1. Initial Boom: The sharp peak at the beginning of the timeline in 2019 likely represents the initial excitement and high customer traffic following the store’s opening. This period often sees heightened review activity as consumers are eager to share their first impressions.
2. Normalization and Declining Long-term Trend: The trend in monthly reviews for the IKEA Store Greenwich reflects a typical pattern in consumer engagement for retail outlets. Initially, the opening of the store generates a high volume of reviews due to the excitement and influx of first-time buyers. Over time, as these first-time customers become regulars, the novelty wears off and the frequency of new reviews declines. This normalization of engagement, particularly evident from 2020 onwards, signifies market saturation and a change in how consumers interact with online reviews. Regular customers tend to post reviews less frequently, only doing so when prompted by significant changes or specific experiences.
3. Periodic Fluctuations: The first significant drop in reviews for the IKEA Store Greenwich around early 2020 coincides with the onset of the COVID-19 pandemic, which resulted in store closures, fewer customer visits due to lockdowns, and altered shopping behaviors. This naturally led to fewer reviews as opportunities for customer interactions diminished. The second notable drop in early 2021 can be attributed to seasonal trends where reviews typically decline after the holiday shopping peak, compounded by the lingering effects of pandemic restrictions that continued to impact consumer behavior and store visits. Together, these factors significantly influenced the fluctuating patterns of review activity during these periods.
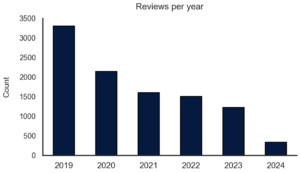
Again, the year 2019 shows the highest number of reviews, which aligns with the store’s opening. This peak is typical of new store openings where initial curiosity and first-time visits generate a high volume of feedback.
Overall, the trend across these years suggests that while the store initially attracted a high volume of reviews due to its newness, the novelty effect has worn off over time, leading to fewer reviews each subsequent year. This evolving behavior suggests a need for innovative strategies to rejuvenate engagement and encourage more frequent feedback from a now mature customer base.
The notable decrease in reviews in 2024 should be viewed with caution, as the data only covers up to April of that year. This partial data could be misleading if interpreted as indicative of a full-year trend. Although I have retained this information in the chart, it’s important to be aware that a full analysis for 2024 cannot be conducted until the entire year’s data is available.
Assessment of customer satisfaction
I’m curious about the development and evolution of the star ratings over the years, so I’m first calculating the percentage change in star ratings from 2022 to 2023. To calculate the percentage change, I initialize a dictionary to store the percentage change for each rating. Then, I loop through each rating to calculate the percentage change. For each rating, I filter the reviews and get the counts for 2022 and 2023. The percentage change is then calculated using these counts.
					# Initialize a dictionary to store the percentage change for each rating
percentage_changes = {}

# Loop through each rating to calculate the percentage change
for rating in sorted(greenwich['rating'].unique()):
    # Filter for the specific rating
    specific_rating_reviews = greenwich[greenwich['rating'] == rating]

    # Get counts for 2022 and 2023
    count_2022 = specific_rating_reviews['date'].dt.year.value_counts().get(2022, 0)
    count_2023 = specific_rating_reviews['date'].dt.year.value_counts().get(2023, 0)

    # Calculate the percentage change
    percentage_change = ((count_2023 - count_2022) / count_2022) * 100 if count_2022 > 0 else None
    percentage_changes[rating] = percentage_change
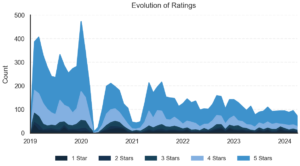
Now, I’m plotting a stacked area chart to see the overall distribution of star ratings over the years. A stacked area chart is beneficial because it shows both the overall trend and the contribution of each rating category to the total over time.
The stacked area chart shows the cumulative development of individual rating levels. The most significant drop is seen in the 5-star ratings, which fell by over 22%. This is closely followed by the 4-star ratings, which decreased by over 16%. The 3-star ratings also saw a substantial decline of just over 4%. Interestingly, the 1-star and 2-star ratings saw smaller declines, with the 1-star ratings decreasing by about 8% and the 2-star ratings by approximately 2.5%. These patterns may indicate a shift in customer engagement or satisfaction.
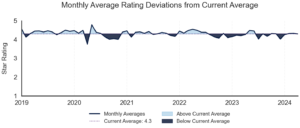
The yearly average star ratings reveal that customer satisfaction has remained fairly constant around an average of 4.3, with only minor minor fluctuations from 4.36 in 2019 to 4.24 in 2023.
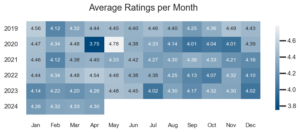
The average ratings per month heatmap shows a noticeable dip in April 2020, with the lowest rating of 3.75, likely reflecting the initial impact of the COVID-19 pandemic. Overall, the ratings tend to stay fairly consistent around 4.3, with slight variations throughout the months and years, indicating a stable level of customer satisfaction.

